Developed by Microsoft, Power BI is a data visualization tool that empowers business leaders across the globe, boasting an intuitive user interface that enables business users and developers alike to create meaningful visualizations.

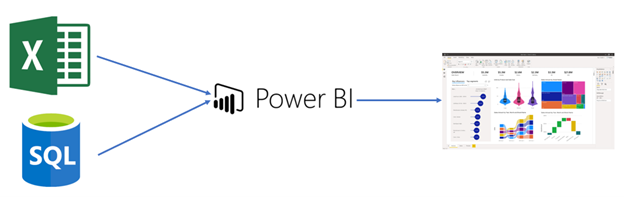
Power BI’s ability to connect to Excel spreadsheets, cloud-based, or on-premises data sources allows for maximum versatility. Multiple data sources can be utilized within a report by creating relationships between common data items. Data sources can also be transformed to include the necessary business logic needed for visualization.


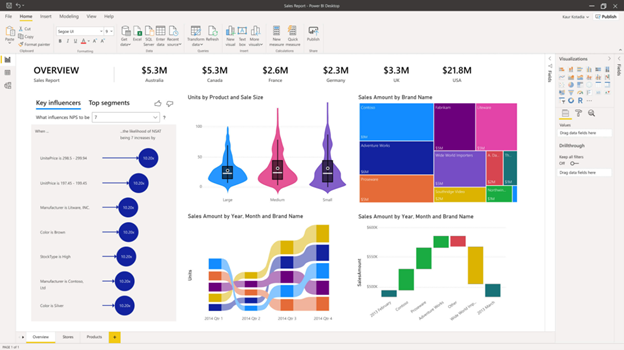
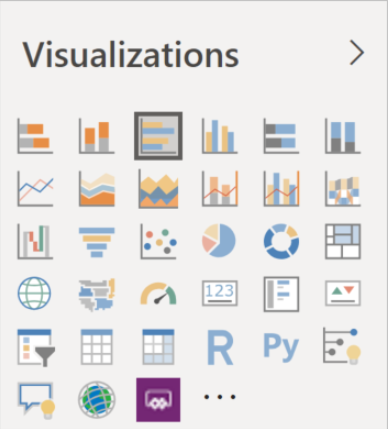
Power BI utilizes a desktop-based development application where users can connect to data sources and build out interactive visualizations. A wide range of customizable visualizations and data tables are offered to fit every need.

Once reports are complete, they can be pushed to Power BI Service, a browser-based application allowing for viewing and maintenance of reports and dashboards. Here, users within an organization can view visualizations, make edits, and set permissions for content stored within.

Overall, Power BI is an intuitive, highly beneficial tool that allows business leaders everywhere to make data-driven decisions by providing them with interactive and actionable visualizations as an extension of their Microsoft Suite.


Store Location Form


Accounting Automation: Leveraging Alteryx and Power BI for Efficient Reconciliation

Accurate and timely reconciliation is a critical component of accounting. Whether it’s aligning journal entries with invoices or reconciling financial reports from different platforms, this process ensures consistency and helps prevent discrepancies from moving downstream to critical reporting. For finance teams, reconciliation not only provides clarity, but also supports internal auditing efforts. However, as essential […]

5 Reasons Why CPA Firms Must Embrace Technology Now

CPA firms face significant challenges, and the need for digital transformation has never been more urgent. The stakes are high; if you don’t adopt technology now, it could mean the difference between thriving and barely surviving. Sticking with manual processes isn’t just inconvenient—it’s a threat to your firm’s future. Overworked staff are leaving, leading to […]

Unleash the Power of Oracle BI Publisher and Power BI Integration with ExoInsight 

Introduction  Enterprise reporting and analytics is critical and becoming more important every year. Companies have tight margins, fierce competition, and business models need to change quickly to stay relevant.  Most companies have data in dozens of legacy and cloud applications, and most complex questions require information from multiple entities to reach an accurate answer.  The […]

Supercharging Power BI: Harnessing the Power of ChatGPT for Advanced Data Visualization and Analysis 

In this video, we will see how we can use ChatGPT to analyze and document applied steps in the Power Query Editor. By copying the Mashup code and pasting it into ChatGPT, you can obtain detailed documentation with a comprehensive breakdown of each step. Are you a new Power BI developer struggling with DAX calculations? […]

Power BI Finance Dashboard: Integrating Financial Data with Microsoft Power  BI

Data visualization is key for companies that want a better understanding of where their business currently stands and which areas could increase productivity to enhance efficiency and generate more profits. There are many data visualization software options on the market, and it can be difficult to figure out which solution is best for your business. […]

Vendor Round-up: Comparing Alteryx, Tableau, and Power BI for Data Visualization and Data Wrangling 

Alteryx  Visualization: 3 out of 5  The current Alteryx platform has limited visualization and reporting capabilities. There are some excellent data investigation tools and visualization tools for workflow developers. Alteryx also provides some limited tools for reporting, but it does not replace a business intelligence or dashboarding tool.  Data Wrangling: 5 out of 5  Alteryx […]

Why do Power BI users need Dremio? It unlocks your data lake!

The purpose of this article is to highlight how Power BI users can benefit from Dremio and show its easy integration. Dremio is a SQL Lakehouse Platform that allows companies to run interactive analytics and high-performing dashboards directly on the data lake storage. It eliminates the need for proprietary and expensive data warehouses. To understand […]

Alteryx Power BI: Push Content Into Power BI from Alteryx Workflows

Overview With the Microsoft Power BI Output Tool, users can capture the power of Alteryx’s Analytical Processing Automation (“APA”) and Extract, Transform, and Load (“ETL”) capabilities and pair them with the immersive dashboards and reports generated in Microsoft Power BI. Transform your custom-built Alteryx Power BI Workflows into dynamic visualizations when posting to the Microsoft […]