Workflows can constantly be changing, whether due to new data being available, format changes, additional requests, or other circumstances. Additionally, not all Alteryx users have access to Designer and may not be able to see what goes on in the background The Audit Reporting feature of WAM allows users to create an overview report for any workflow quickly and effortlessly, keeping track of tool configurations and changes without requiring Designer, and the right WAM optimization steps can greatly improve your workflows. These reports include the following components:
- The file location of the workflow
- The version of Designer that the workflow was created in
- Recommendations to improve performance
- A tool breakdown by category
- An Input/Output summary with file paths and queries
- Configuration details of every tool
- A flow graph showing the data connections between tools
Keeping track of changes is crucial when updating a workflow, especially for temporary or proposed changes. Having an audit of every version of a workflow gives users a quick reference to compare these changes without having to open Designer and flip back and forth between different versions of the same workflow. Instead of clicking through tools to compare them, users can open the Audit Reports built by WAM and compare the tool configurations based on the tool’s ID number, or review the flow chart at the back of the report for bigger changes such as adding a branch or input to the workflow.
The Tool Configuration Details section of each audit report allows users to quickly glance at a tool to see how it is configured rather than going into Designer, finding the tool, and studying its configuration there. Comparing workflows with Audit Reports in .docx format is also much easier than having two Designer windows open.
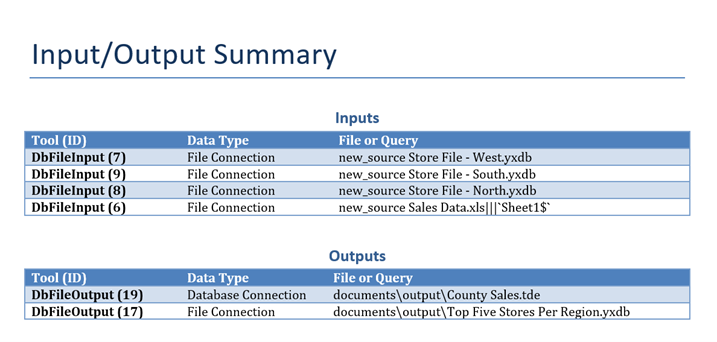
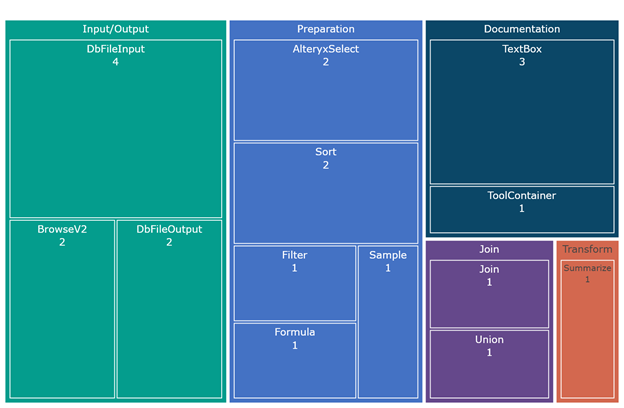
These reports also provide an overview of the workflow, displaying the Input/Output summary and tool breakdown by category. For example, using the screenshots below, we can tell that this workflow takes data from four files: three .yxdb files and one Excel File, and outputs a Tableau data extract and a .yxdb file that contains the combined data. We can also tell that this workflow is mainly concerned with cleaning and prepping the data from the input files, as it consists largely of preparation tools.
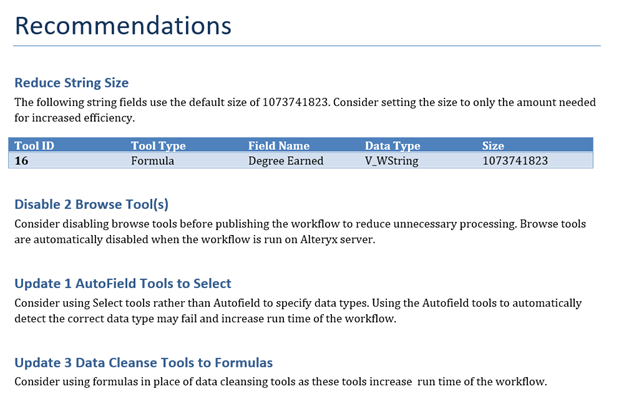
This report also contains a section that gives recommendations on how to improve your workflows. These suggestions help ready your workflows for a production environment. They tell you how to optimize your workflows and allow them to run more efficiently going forward. Below is a screenshot of a few recommendations given by WAM.
By comparing these two pages, we can get a high-level understanding of what this workflow is doing without ever opening Designer. To get a better idea of the workflow, we can look at the Flow Graph at the end of the report to see how the data flows from one tool to another, without even opening the workflow. Reviewing just three pages from the Audit Report, it is no surprise that the actual workflow looks like this:
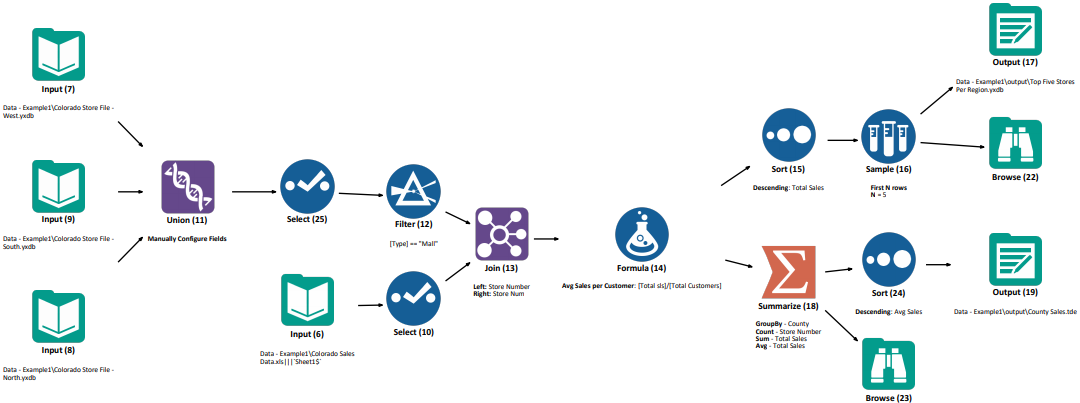
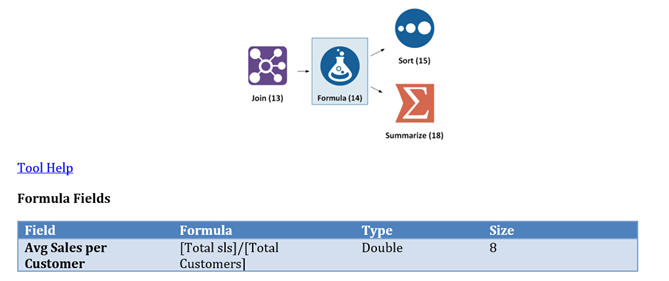
But what if a Gallery User needs to know more about how the workflow functions at a deeper level? For instance – What is that filter tool filtering, or what is being calculated with the formula tools? Simply review the Tool Configuration Details of the report. This section keeps track of what each tool does or how it is configured. For example: Which field was renamed with a Select tool? Which fields are coming from which input file, and which field is the header and which field is the value for a Cross Tab? In the example workflow, we can immediately tell that the formula tool is creating a field “Avg Sales per Customer” and setting the value to [Total sls]/[Total Customers].