Endless possibilities: Infusing AI BI with Cognos Analytics
Traditional business intelligence (BI) solutions have little hope of making sense of the volume, variety and speed of data being created. Connecting this downpour of business data requires a new approach to BI, one that is enabled by the features embedded in IBM Cognos Analytics. Powered by an ever-growing set of augmented intelligence (AI) features, Cognos Analytics has been restructured for the needs of today’s organizations and users. Cognos Analytics primes organization to grasp opportunities and respond quickly to emergent threats. In a business climate where previous borders, boundaries and status quo no longer apply, AI-powered BI helps businesses thrive as they redefine what’s possible. Whether you have a question to answer, an assumption to test or you are not quite sure what you want, we’ve got you covered with IBM Cognos Analytics and Business Intelligence solutions. Business intelligence (BI) and advanced analytics provide the edge in extracting insights from data – to identify risk and capitalize on opportunities. Gain a deep understanding of your business with reports, dashboards, visualizations and analysis of information. IBM’s enterprise platform approach, available on cloud or on premises, aligns your organization around trusted data and self-service capabilities enable agility to accelerate growth.
Cognos Reports
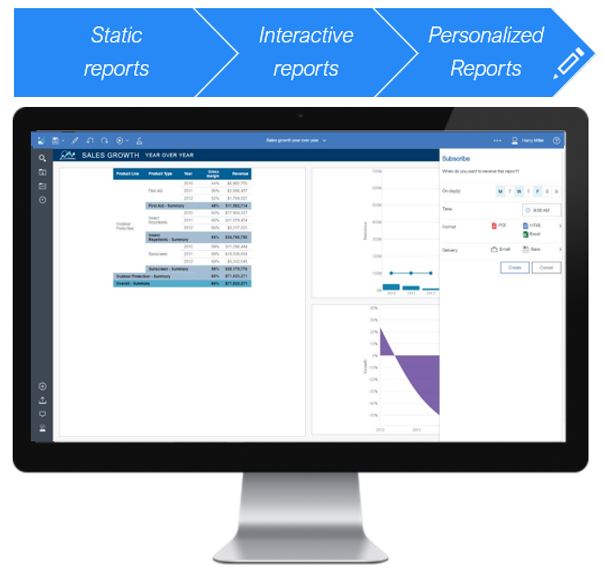
Static Reports - Ideal for fixed format reports where users cannot alter the data or the format, presentation guides user understanding, usually professional authored pixel perfect reports, burst out to an unlimited number of consumers via email or saved output – captures a point in time view, can be embedded in URL or other apps or as reporting on demand, both online and offline consumption
Interactive Reports - Provides users with a starting point from which to explore, Similar capabilities to static reports, but built for full interactivity, all widgets can be totally responsive to all others so each acts as a global filter for the entire dashboard (option to edit this at the widget level), global filters to slice and dice information
Personalized Reports - Save your view – Apply filters to slice and dice information to suit your needs – include/exclude data, group, pick up the pencil and make edits such as adding calculations, subscribe to static, interactive or personalized reports at the frequency you want and in the format you want
Ad hoc Reports
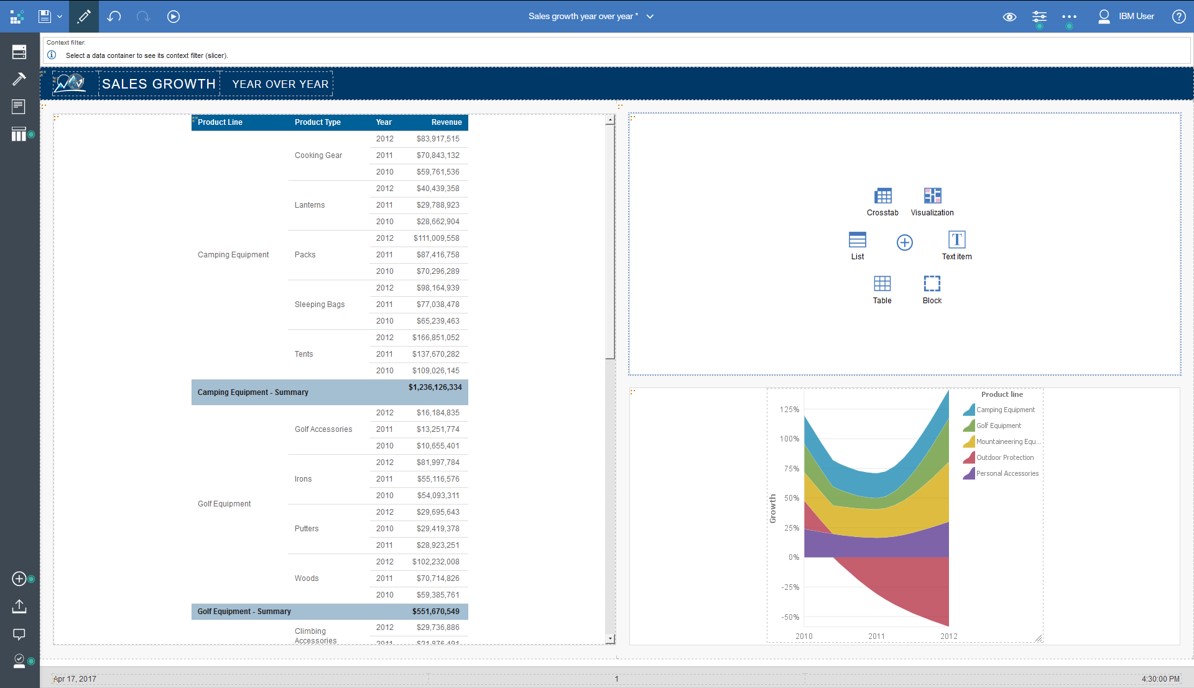
Data Explorers can edit and author ad hoc reports based on their skill level, and then hand off to a more experienced user to polish and operationalize this can expedite the queue for professionally authored content by skipping the requirements stage. Ad hoc reports can be built from the + or CREATE menu as a “report” or “dashboard” depending on user skill level Graphical UI and on demand menus for report authoring appear only when you need them User can prototype what they want and hand off to a power user to polish and operationalize report
Storytelling
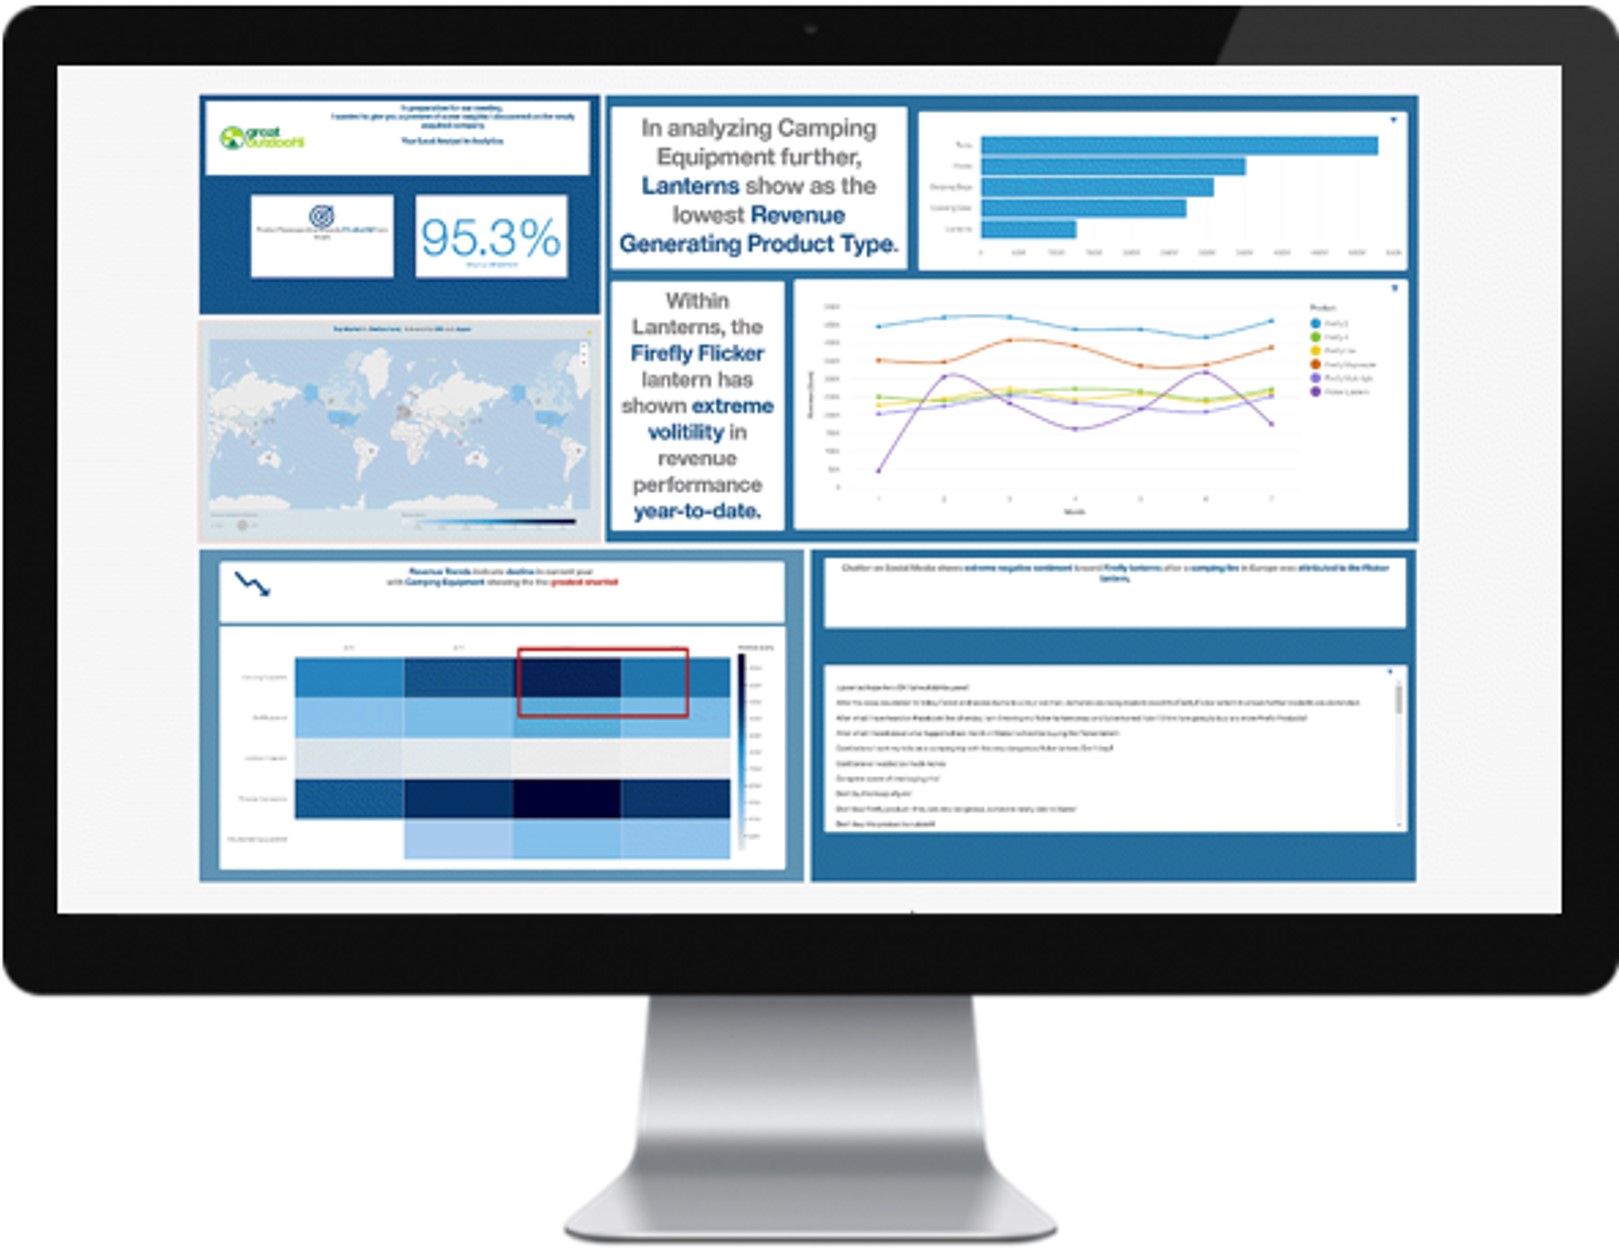
Storytelling is a new capability that lets a user present their insights directly within Cognos Analytics in a very dynamic and engaging way. It saves the effort of exporting to PowerPoint. Various story arcs are available and visualizations from dashboards can be pinned for use. Easy presentation of findings in a focused and interactive manner, created without leaving interface, and simpler than a tabbed dashboard. Choose from a selection of guided journey templates and drag and drop data for instant visualizations or select pinned ones from other dashboards. Useful features include instant infographics and text animations, smart naming in pins and timeline, animation options.
Dashboards
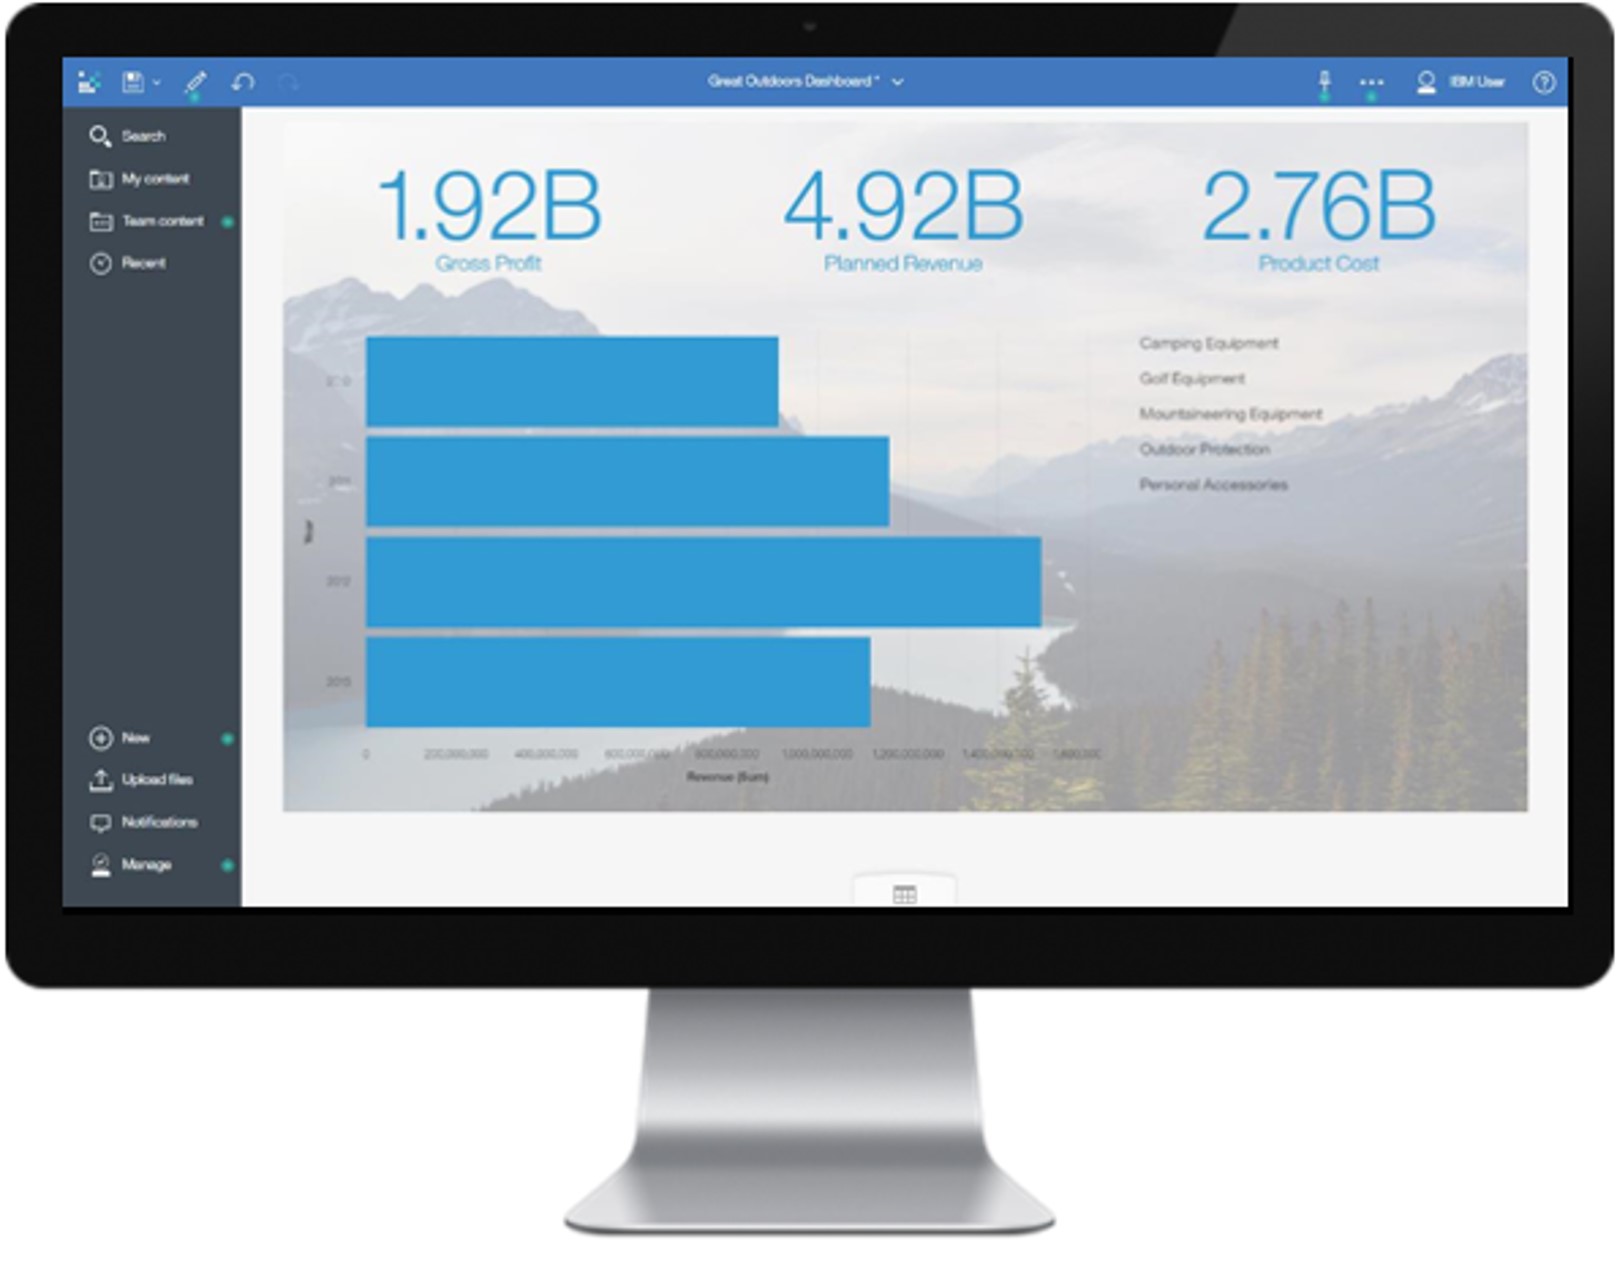
Dashboards are the next level of self service where the user starts to create from a blank canvas. There is an embedded video that shows various examples of dashboards. Dashboards are a great place to start your demo to illustrate how, with a few clicks, you can bring data to life and start to explore. Business dashboards have become important tools for monitoring and improving performance. IBM Cognos business intelligence includes interactive business dashboard software that can take the confusion and guesswork out of navigating your business information and key performance indicators. You can personalize these dashboards and choose how you receive them to keep your finger on the pulse of your business, identify issues before they become problems and analyze information to plan for the future. Dashboards are fully interactive and feature simple drag and drop interface, world class maps and polygons in box, and prototype and validate information for sharing.
Self Service Modeling - Build Your Own
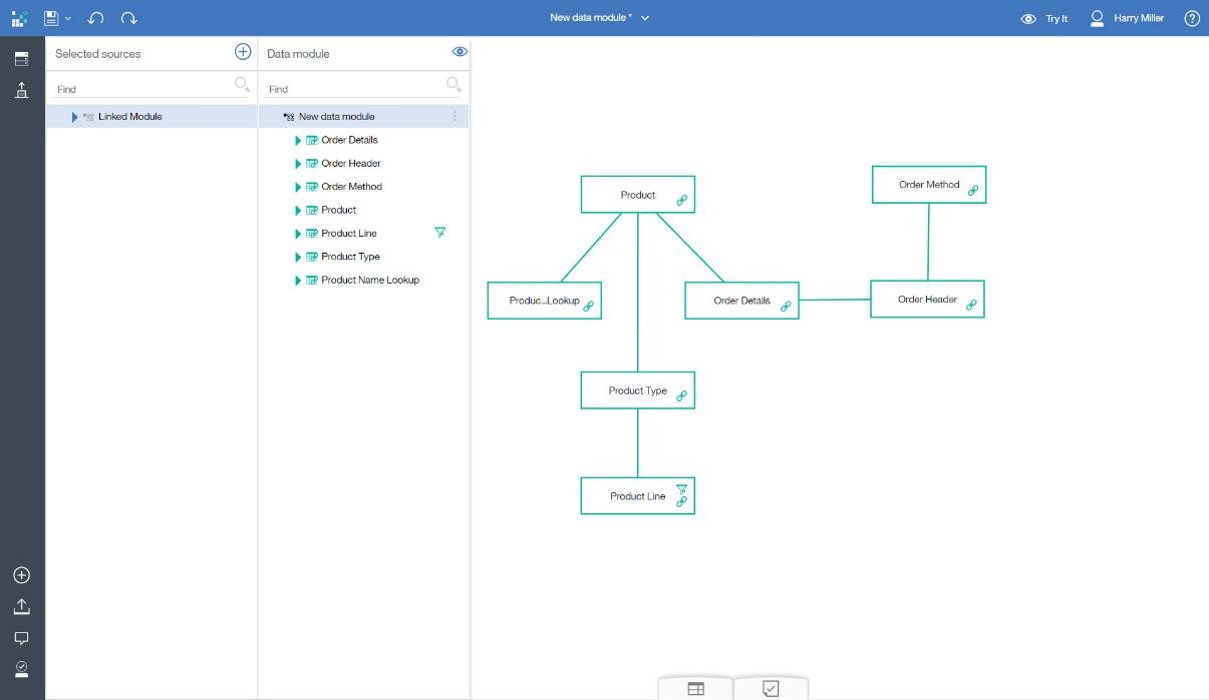
A key enhancement in Cognos Analytics is the introduction of Data Modules which is a business user oriented data modeling environment. With interactive drag and drop features, users can easily build data modules that suit their needs. These can be a combination of data from pre-built packages, spreadsheets and other data sources. The big benefits include reusability and sharing of models, and the ability to leverage governed models. Build on models from others and benefit from their updates or take your own path. Ease of use features: cleansing, create calculations, relink to a new source, formatting options, enhanced diagram interactions, enhanced Expression Editor. With Build Your Own Self Service Modeling the business user can easily join/select data with data modules feature. Models proposed from keywords, drag & drop interaction of visual model, build from any combination of governed data sources directly, governed pre-modeled data sources, uploaded files and other ungoverned sources.
Self Service Modeling - Uploaded Files
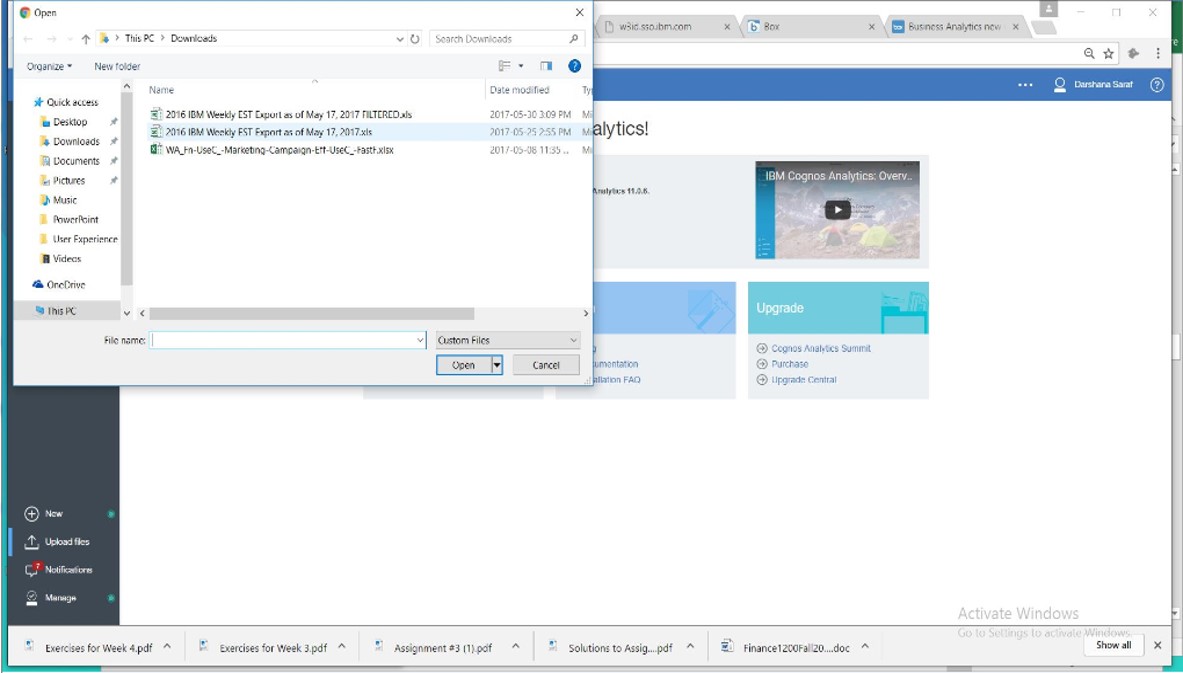
It is very simple to upload a spreadsheet into Cognos Analytics and begin using it for dashboards or stories. With certain data, there is no need to bring it into a central data warehouse - it might be transient - like monthly survey data etc. and the upload file option is a good way to explore it and even combine it with other data sources. Designed for the business user, accessible from main menu, uses smart search to help find files, data presented in a grid format, some data cleansing available, ready for immediate use in dashboards, stories, reports

Data Models and Professional Reports
Your power users / data analysts will be called on to create standardized production reports and pre-built data models for the rest of the organization to use as their official sanctioned sources. For these users, there is a very robust modeling tool called Framework Manager that provides full flexibility, including row level security. A "Report" from the create / + menu provides all the production, pixal perfect reporting capabilities including bursting and scheduling. Certain data must be tightly governed. Framework Manager lets IT or power users pre-model data into packages with row level security. Full range of bursting and scheduling options, alerting and notifications, formats options. Generally power users or IT are the authors of official corporate reports that consumers use on a regular basis for decision making or that are provided to regulators or stakeholders
Off Line Reports
Sometimes there is a need for individuals to access reports in a disconnected mode or there is a need to get reports out to users who do not hold licenses. This can be done with Cognos Analytics. Off Line Reports are usually professionally authored, predefined interactivity, reports are distributed via email or pulled from a network location. for use cases where the users will not have access to a browser to consume, and can be shared with unlicensed users.


Scheduled Reports
Scheduled Reports provides production reports with a visual of how you can set up a scheduled report including the various options. Full flexibility to burst reports to small groups or scale to thousands of users, scheduling options include, date and time, recurring frequency, format, delivery options, prompts, language,enables automation of insights to run the business
Additional Cognos Resources
No posts found.


